H+N+S advised on the agriculture and land-use sector table which, under the leadership of Pieter van Geel, had eight working groups studying the opportunities within agriculture and land-use to achieve a reduction of 3.5 Mton by 2030, with a view of the possibilities to realize an additional target of 1.7 Mton. The H+N+S report shows which spatial expression the measures will receive and how our landscape will change. In return, the landscape instructs where it is most beneficial and effective to place the measures, and what links there can be with other social issues.
Climate + Agreement
Climate measures for a liveable landscape
In order to reach a climate agreement in 2018, five 'sector discussion tables' were negotiated with all major parties in the Netherlands in the first half of the year on the main features of this agreement. On 10 July, the results of the five sector tables were presented to Minister Wiebes (Economy and Climate). At all five tables - Industry, Built Environment, Mobility, Electricity and Agriculture and Land-Use - spatial experts were connected.
Assignment
The H+N+S report 'Climate measures in a Liveable Landscape' has been presented together with the results of the discussion table 'Agriculture and Land-Use' to Minister Wiebes. The task of this report was to give a vision for the 3.5Mton reduction of CO2 emissions from the agriculture and land-use sector for 2030.
The energy measures should envision the cut of 1 Mton from the greenhouse horticulture and fuels (for the tractors and power tools) and 2.5 Mton from non-energy related measures (smarter land-use, anti-Methane emissions livestock farming, forest expansion etc). A view was also provided on the reduction of an extra 1.7 Mton, through manure and land-use measures.
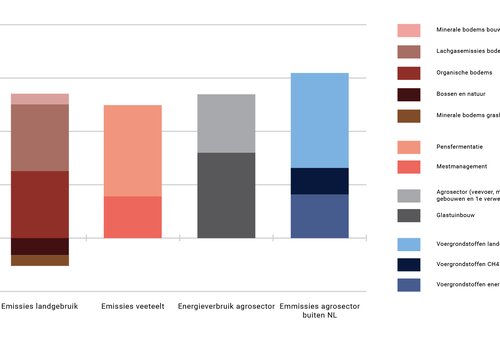
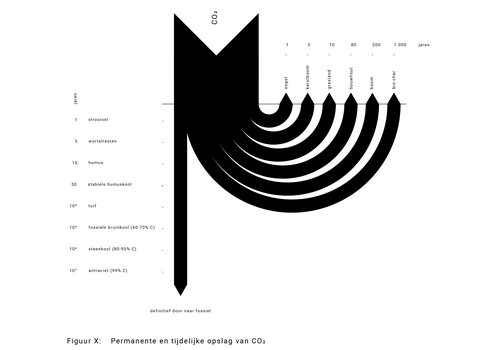
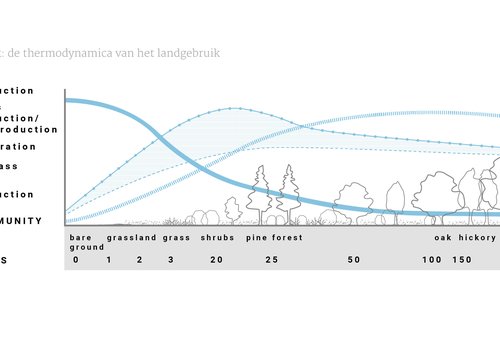
The assignment revealed to us that land-use and agriculture has a direct relationship with the climate problem, not just through the energy transition, but through the literal inhalation and exhalation of our cultural landscape and the metabolic processes of our domesticated animals. The peat drainage and its oxidation (and therefore emission of greenhouses gases) is one of the well-known examples.
Results
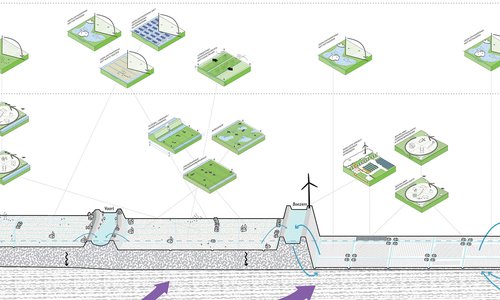
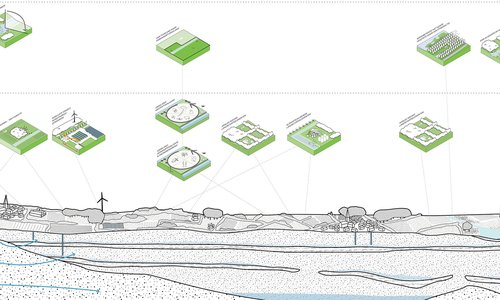
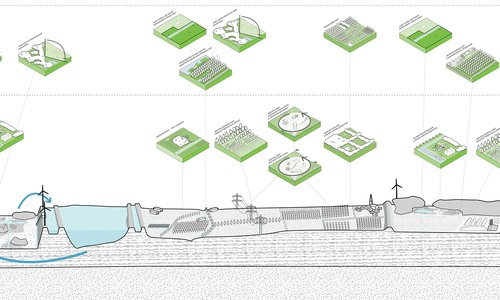
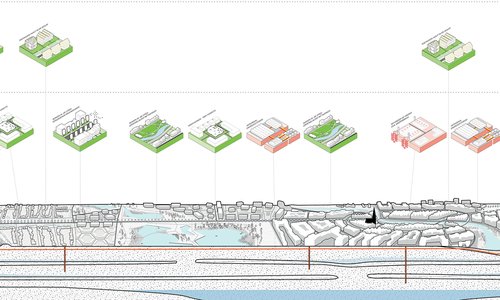
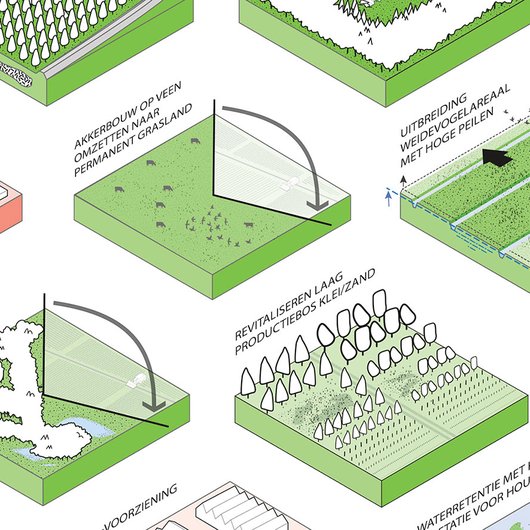
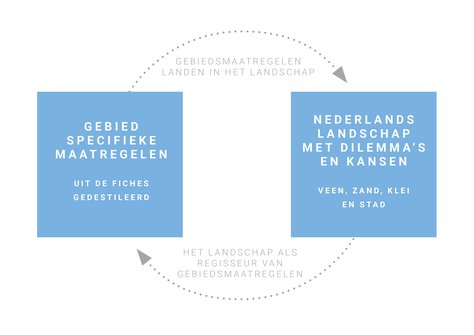
We are showing in our report how the measures proposed at the sector table will visibly change the landscape. In return, the landscape instructs where it is most beneficial and effective to place the measures. We present this on the basis of system cross-sections of the four most important Dutch landscapes: the sand, clay, peat and urban landscape. This area-oriented approach also provides an opportunity to map the climate issue with other social objectives. Climate measures in land-use can act as leverage to facilitate other spatial processes, and by coupling to other processes can also make climate measures more flexible and cheaper.
We have worked out the relationship between land-use and climate on three different scale levels: on a global scale to get a feel for the scope of the issue, on a European scale to position the highly productive Dutch agriculture, and on a national scale to investigate the spatial impact of the measures.
World
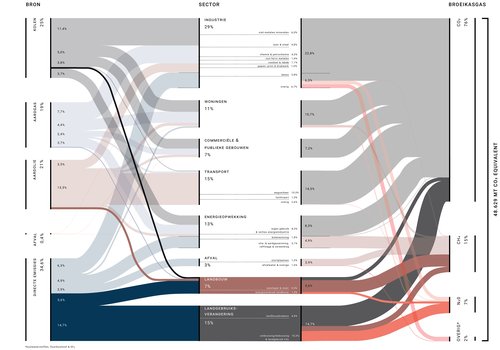
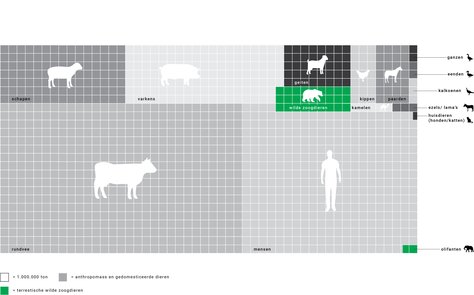
We show here in a Sankey diagram what role agriculture and land-use play at a global level in the production of greenhouse gases. Also striking is the enormous role of land-use’s changes - such as deforestation, dewatering peat and other reclamations. These changes account for 15% of greenhouse gas emissions, comparable to global transport (shipping, aviation, road traffic, trains, together also 15%) or the total energy generation sector (13%). The share of agricultural emissions itself is 7%, of which 5% is from manure and rumen fermentation from ruminants. For those who are - like us - amazed about this prominent role, we will go deeper into the report on the HANPP, the Human Appropriation of Net Primary Production, showing the part of the primary production of our biosphere (land and ocean) that is appropriated by humanity. The consequences for biodiversity were well received in the following infographic summaries. If you add up the weight of all land mammals, 95% of it appears to consist of humans and our domesticated animals and only 5% remain for the wild mammals such as elephants, lions, tigers, rats, mice, giraffes, wolves et cetera. If you also consider that for the production of 1 kg of meat about 7 kilos of grain is needed, it becomes understandable why one of the measures considered in the sphere of nutrition, is the switch to more vegetable protein.
Europe
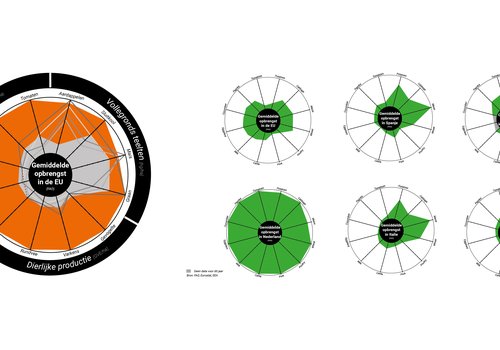
The Netherlands has a leading position in Europe (and the world) when it comes to high productivity. We also have the highest yield of agricultural exports from all European member states with nearly 91 billion Euros/year. In absolute terms, the Netherlands only stand behind the USA regarding agricultural productivity.
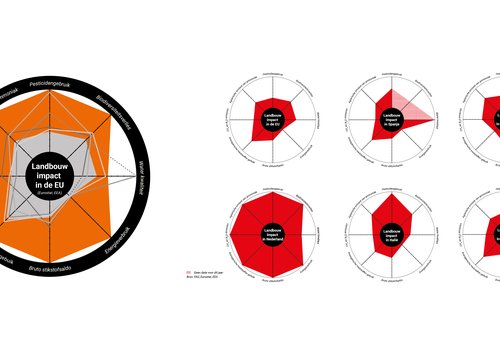
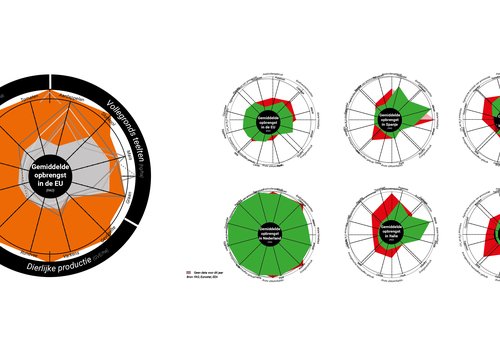
The fact that such high yields can be realized on such a small area has to do with the professional competence of our farmers, but also with the agricultural knowledge clusters of which Wageningen is the largest and the most international. The Netherlands is the largest exporter of agricultural knowledge. That this came with noticeable neglect of the environmental quality and biodiversity can be read at a glance from the infographics compiled by us (from data from Eurostat) in which we compare the Netherlands with the four main European competitors, France, Germany, Italy and Spain, as well as the European average.
Netherlands
The working groups from our discussion table have generated a rich harvest of climate measures. These are written by secretaries under five pillars in the proposals for the main lines of the climate agreement.
- Agriculture;
- Land-use;
- Energy measures;
- More climate-friendly food consumption;
- Innovation agenda.
H+N+S has made a distinction between generic measures (such as a front-runners scheme for greenhouse horticulture, or reducing food waste from limiting methane emissions in manure storage) and site-specific measures (such as adjusting crop rotations in arable lands, phasing out of the climate adaptation of the Natuur Netwerk Nederland or adjusting summer levels in peat meadow areas). These site-specific measures depend on the geographical location within the Dutch landscape. Once implemented, they will, in turn, modify it spatially at a local or large scale.
We show in the system-sections of the four typical Dutch landscapes where measures may take place, if these measures lead to a change of function in an area, and where links with other spatial assignments are obvious.
By using a local perspective, the link with other tasks is also obvious. Examples are water declarations, biodiversity issues, soil quality, drinking water protection, nitrogen via the PAS et cetera. Climate performance can be significantly improved by working together with or joining with other interests. The climate measures can also give a interesting boost to other, sometimes difficult, territorial processes. It can seem unnecessarily complicated and partnerships are not always possible but looking somewhat broader than the CO2 targets alone can lead to important social added value that will make ultimately the processes surrounding the climate challenge smoother, especially if the spatial quality in the partnered project is also important.
THE FINE RULES THROUGH AGREEMENTS AND ORGANIZATION
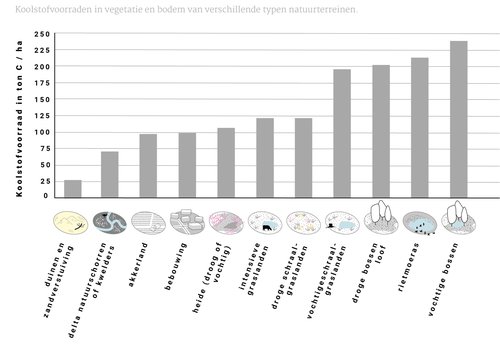
How can these place-specific measures now be placed in the extensive task for which agriculture and land-use are set? We could say that part of that assignment is feasible through technical, generic measures. But the complete specification of 3.5 Mton reduction in 2030 and ultimately a 95% reduction in 2050 cannot be achieved without the place-specific measures. These measures are often more complicated because multiple interests and parties are affected or served. Therefore, place-specific measures, starting with the peat meadow areas, will receive more and more emphasis. In other words, agriculture and land-use will have to optimize their climate performance by fine-tuning spatial planning at regional and local levels. This intends to further reduce the emission of greenhouse gases and make optimal use of the potential of capturing carbon in soils, plants and forests in order to achieve the goals of 2050 in an elegant way.
This should be done through processes that can provide tailor-made solutions for each type of landscape and provide a beckoning perspective for local parties to get started. This perspective must bridge climate measures to other tasks and revenue models for involved parties. Additionally, we will discuss the possibilities of using solar farms in such a way that they can act as a flywheel for action in the agricultural transition. This might include addressing the role of carbon uptake in the soil, and considering the importance of carbon-conscious farmers regarding the greenhouse gases that are released during the changes in land-use.
The landscape theme in the climate agreement
Just like the 'agriculture and land-use' table, each sector table was provided with a design consultant, as well as a representative from the general table council chaired by Ed Nijpels. The joint teams then wrote a passage for the 'landscape' section, which is included in the main report of the climate agreement. In addition, all sub-reports have been merged into an extensive document which has also been published via the climate agreement.
The proposal for the main lines of the climate agreement can be found here
